Smart Weather Sensor Climate Monitoring – Arduino and BME280
Remote Climate Monitoring – Temperature, Humidity, Pressure Monitoring WebPage Display
Smart Weather Sensor using Arduino – No server needed! Gather temperature, pressure, humidity and display them on your private Webpage and chart them, and display the actual values on demand.


Components Needed for Climate Monitoring Device
- NodeMCU ESP8266
- SparkFun Atmospheric Sensor Breakout – BME280
- Everything ESP Wemos D1 Min
Get the Softwares From – RemoteMe.org cloud
What we are looking At?
Build your own website which will display the value of temperature humidity and pressure of the place you want. Smart Weather Sensor using Arduino is absolutely free and easy as you don’t need a server database or a public IP for you to access the data or the website. this one is very secure because only people with a particular dedicated link will be able to access your webpage. the project is really easy and I have included a video tutorial for you to make one yourself.

Sponsor Link
This Project is Sponsored by UTSource. UTSource is a professional electronic components supplier.Smart Weather Sensor and Climate Monitoring using Arduino
I will be dividing this tutorial of Smart Weather Sensor two parts. In the first part I will show you how to get the values of temperature and show it on a webpage. In the second part I will show you how to get all the weather parameters from the sensor – that is temperature pressure and humidity at a regular interval, store it on the cloud which can be later accessed from anywhere.Climate Monitoring Video Tutorial

Part 1 – Getting Temperature, Pressure and Humidity Value
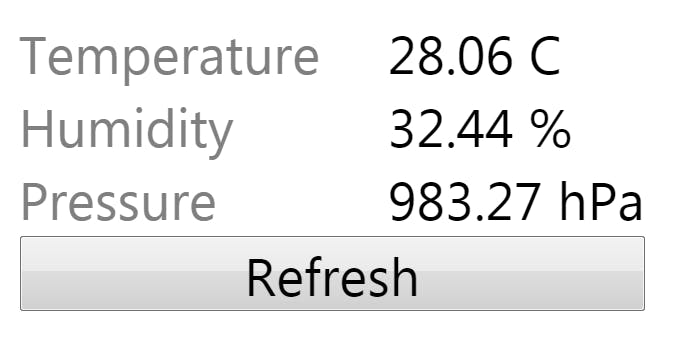
Our Aim
This is what we aim to achieve from this part. The current climate of the place where the sensor is kept.
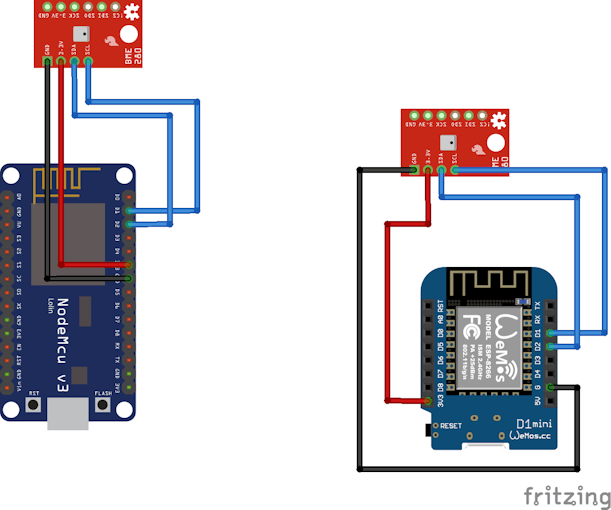
Connections

Step 1 : Setting up app.remoteme.org
First thing to do is set up an account and create a token in app.remoteme.org.
Signup

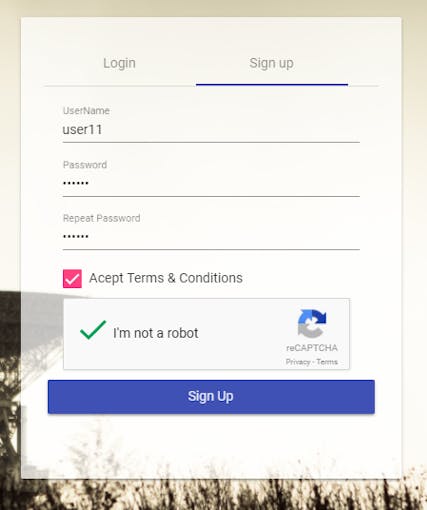
- open remotemeMe.org app
- Sign Up tab
- Since you are not providing your Email ID, it is not possible to retrieve your password if you forget.
- Click SignUp
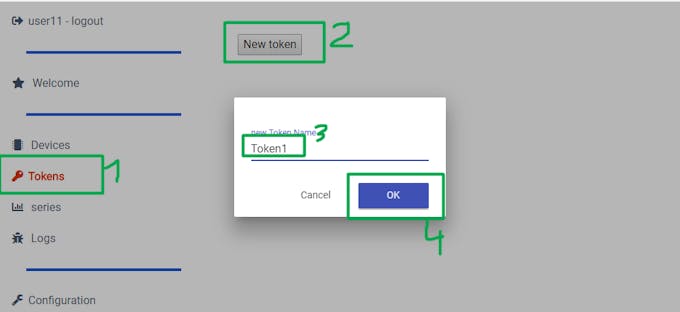
Step 2 – Creating a token
Token is used to connect your weather station to this account. To generate a token follow the steps below- Go to the tab Tokens on the left
- Click New Token, Type a name and click OK
- A new Token will be generated.

Step 3 : Program for arduino
You can find all details for you to get started with Smart Weather Sensor in this quickstart session.
Required libraries:
- Remoteme by remoteme.org
- WebSockets by Markus Sattler
- ArduinoHttpClient by Arduino
- ESP8266WiFi by Iven Grokhotkov
- SparkFun BME280 by SparkFun Electronics
Arduino code can be copy from below[AdSense-A]
Code Explained
I think that the program itself is quite readable, I will describe the most important functions below. Of course, we have to provide the below values:
#define WIFI_NAME ""
#define WIFI_PASSWORD ""
#define DEVICE_ID 204
#define DEVICE_NAME "temperatureOnRequest"
#define TOKEN ""
Upload arduino program to our Weather station. After that go to the Devices tab, our new device will be shown like this.

WebPage
Now it’s time to create a website that will connect to our ESP and show the data.
In the “Devices” tab, select the New button and then “New WebPage”
We will have to upload three files to our website – index.html, script.js and styles.css which are located here. You can simply drag files from github to our website as shown in the video. For more information about creating the website,Click here.
Fire up the site – Click on the index.html file and select the Open in New Tab option. On the new tab will appear our website where after clicking Refresh the temperature, pressure and humidity will change to the current one.Code Explained
Most important part of code is in the script.js file and in the arduino program. Let us discuss the following fragments:
script.js
function setup(){

	remoteme = new RemoteMe({
		automaticlyConnectWS: true,
		automaticlyConnectWebRTC:false,
		webSocketConnectionChange: webSocketConnectionChange,
		webRTCConnectionChange: undefined,
		mediaConstraints: {'mandatory': {'OfferToReceiveAudio': false, 'OfferToReceiveVideo': false}}
	});
}
standard settings. The program immediately connects and registers to the remoteme.org application.
Reference to the function
webSocketConnectionChange: webSocketConnectionChange,
the function itself looks like this:
function webSocketConnectionChange(state){

	if (state==WebsocketConnectingStatusEnum.CONNECTED){
		readDataNow();
	}
}
so after correct connection with remoteme.org, the program reads the data. The same readDataNow () function is called after clicking the “Refresh” button.
Let’s see what the readDataNow () function does:
function readDataNow(){
	remoteme.sendUserSyncMessageWebSocket(temperatureArduinoDeviceId,[],onResponse);
}
it sends the data to our ESP (that’s why you need the temperatureArduinoDeviceId which will indicate the ID (address of our ESP at our example it is 204) as data we send empty table: [], and after the response come the onResponse function should be called.
Let’s move to program on ESP and see how we handle incoming synchronous messages
arduino.ino:
void onUserSyncMessage(uint16_t senderDeviceId, uint16_t dataSize, uint8_t* data, uint16_t &returnDataSize, uint8_t *&returnData)
{
	uint16_t pos = 0;

	returnDataSize = sizeOf(float32)*3;
	returnData = (uint8_t*)malloc(returnDataSize);


	RemoteMeMessagesUtils::putFloat(returnData,pos, (mySensor.readTempC()));
	RemoteMeMessagesUtils::putFloat(returnData, pos, (mySensor.readFloatPressure() ));
	RemoteMeMessagesUtils::putFloat(returnData, pos, (mySensor.readFloatHumidity() ));


}
the above function will be called when a message arrives from script.js parameters:
returnData = (uint8_t*)malloc(returnDataSize);


	RemoteMeMessagesUtils::putFloat(returnData,pos, (mySensor.readTempC()));
	RemoteMeMessagesUtils::putFloat(returnData, pos, (mySensor.readFloatPressure() ));
	RemoteMeMessagesUtils::putFloat(returnData, pos, (mySensor.readFloatHumidity() ));
using the putFloat function, we enter three readings in the output table one by one. So after leaving the function, we have an array of bytes where the following numbers are written: temperature, pressure and humidity of the Smart Weather Sensor.
- senderDeviceId – id of our website
- dataSize – data size of data (at our case its 0 becasue we sent empty array at script.js)
- data -data from websote (at our case there is nothing here)
- returnDataSize – here we will enter how many bytes we will send as the answer – we send 12 because we have three readings, and each is a float number that has 4 bytes
- returnData – here we write return data
Let’s go back to the script.js file and read these values:
script.js
function onResponse(output){
	var data = new RemoteMeData(output);

	var temp = data.popFloat32();
	var pressure = data.popFloat32();
	var humm = data.popFloat32();

	$("#tempOut").html(temp.toFixed(2)+" C");
	$("#pressOut").html((pressure/100).toFixed(2)+" hPa");
	$("#hummOut").html(humm.toFixed(2)+" %");

}
with the popFloat32 pop function, we collect three float numbers one by one and after proper formatting, we display with jquery to the appropriate elements.
Part 2 – Storing the Values on the Cloud and Plotting them on a Chart
This time we dont want to read the temperatures on demand but save the readings from time to time (in the example 5 minutes intervals ) to the server and see the data on the chart
How does it work
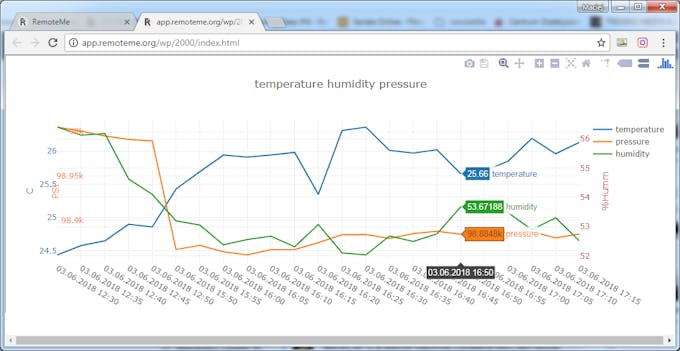
Here, NodeMCU will read the data of the temperature pressure and humidity from the sensor send them to the server and goes to deepsleep mode. after particular interval this process will be repeated again.[AdSense-C] After some time you will be able to see a chart somewhat like this.

Connections

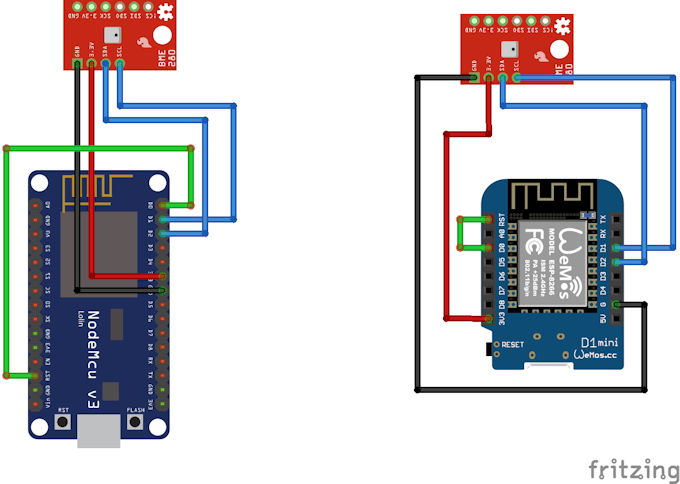
Almost identical as in the project for reading on demand, the difference is the green wire – it allows you to self wakeup the ESP.
Code[AdSense-A]
Just upload to remoteme.org and our arduino . Everything in the same way as in the previous example.
Description of the most interesting code parts
arduino:
data reading from BMY280:
double temp[10];
  double pressure[10];
  double humm[10];
  for(int i=0;i<9;i++){
    temp[i]= mySensor.readTempC();
    pressure[i]= mySensor.readFloatPressure();
    humm[i]= mySensor.readFloatHumidity();
    delay(100);
  }

  sort(temp,10);
  sort(humm,10);
  sort(pressure,10);
We make 9 measurements in a 100ms interval, then sort them, send medians to the server – it will allow you to get rid of wrong data – sometimes our sensor returns strange values
remoteMe.sendAddDataMessage(1, RemotemeStructures::_5M, 0, temp[5]);
remoteMe.sendAddDataMessage(2, RemotemeStructures::_5M, 0, pressure[5]);
remoteMe.sendAddDataMessage(3, RemotemeStructures::_5M, 0,humm[5])
and send them to the server, each data is sotred at diffrent data series (1, 2, 3) and time is rounded to 5minutes – it will helps draw nicer chart
after the measurements ESP falls asleep for 4 minutes
ESP.deepSleep(1e6*60*4);//4min
script.js
The most interesting part is receiving data and display them on the chart.
function createChart(){

   var yestarday=moment().subtract(1, 'days').format("DD.MM.YYYY HH:mm");
   var now=moment().format("DD.MM.YYYY HH:mm");


	var url =`/api/rest/v1/data/get/dd.MM.yyyy HH:mm/${yestarday}/${now}/1,2,3/`;

	$.get(url, function(data, status){
applications provide our data under the link
(documentation of the entire REST Api remoteme.org app is here )
/api/rest/v1/data/get/{FORMAT}/{FROM}/{TO}/{SERIES ids}/
URL will returns us data for series which was provided in {SERIES ids} time will be formatting using {FORMAT} and data will be from [ {FROM} – {TO} [period. Data are return as json
in our example, javascript will generate a link:
http://app.remoteme.org/api/rest/v1/data/get/dd.MM.yyyy HH:mm/02.06.2018 18:53/03.06.2018 18:53/1,2,3/
data are read for one day back. You can easily change it.
Let’s check what I find under the given link (I limited the time to 20 minutes)[AdSense-C]

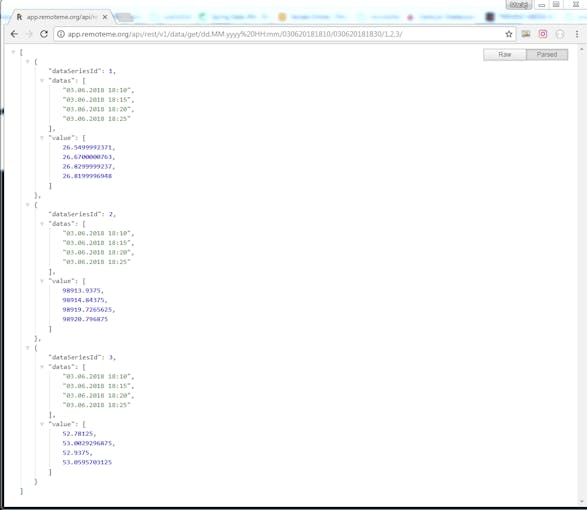
“dataSeriesId” is id of our data series so under dataseriesId:1 will be temperature becasuse at arduino we have
remoteMe.sendAddDataMessage(1, RemotemeStructures::_5M, 0, temp[5]);
and first function argument means dataseries 1
because in the link we have 1, 2, 3 as series ID, all series are returned all together
Then downloaded json is displayed using plotly :
To see this chart You have to open index.html excatly as you did at previous example
Whole function and api documentation used in Smart Weather Sensor using Arduino can be found here ,